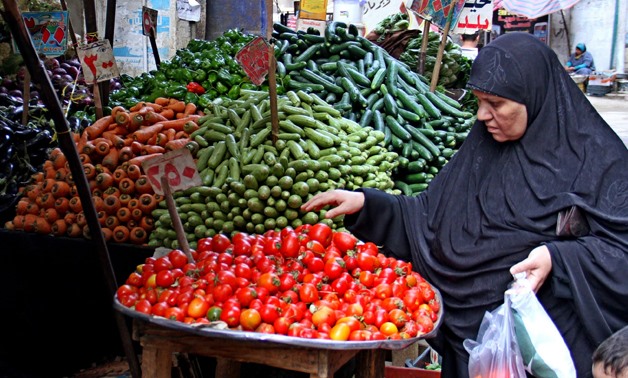
FILE- A woman buys vegetables in a market in Egypt- Egypt Today- Hussein Talall
CAIRO - 9 February 2022: Egypt’s annual urban inflation rate rose to the highest level in more than five years during January 2023, driven by a series of currency devaluations since March 2022, a prolonged shortage of foreign currency and persistent delays in bringing imports into the country.
The Central Agency for Public Mobilization and Statistics (CAPMAS) announced Thursday that the annual urban inflation rate surged in January to 25.8 percent, compared to 21.3 percent in December.
This is the highest level of inflation recorded in Egypt since December 2017, when it recorded 21.9 percent, a month after the Central Bank of Egypt, led by its former president Tarek Amer, liberalized the exchange rate of the pound in November 2017.
According to the state-statistic body’s data, the annual inflation rate rose to 26.5 percent in January 2023, compared to 8 percent in the same month of prior year.
Egypt is witnessing an inflationary wave that has been accelerating almost every month since the beginning of 2022, as a result of the high costs of importing energy and food, due to the Russian-Ukrainian crisis, and the Corona epidemic crisis.
Egypt reached an agreement with the International Monetary Fund (IMF), in November, worth $3 billion. It also devalued its currency twice, in March and late October, after an exit wave of hot money on the successor to the Ukraine crisis and the US interest rate hike on the dollar.
On a monthly basis, inflation recorded 150.6 points in January 2023, recording a 4.9 percent increase compared to December 2022, the CAPMAS said.
CAPMAS attributed the increase in inflation to the rise in the prices of the cereals and bread group by 6.6 percent, the meat and pourtly group by 20.6 percent, the fish and seafood group by 9.4 percent, the dairy, cheese and eggs group by 10.3 percent, and the oils and fats group by 7.8 percent.
In addition to the increase in the fruit group 3.8 percent, coffee, tea and cocoa group by 10.9 percent, ready-made clothes group by 1.3 percent, shoes group by 1.9 percent, the actual rental of housing group by 1.0 percent, furniture, fixtures, carpets and other floor coverings by 3.0 percent, and the group of household appliances by 4.1 percent.
Furthermore, the group of outpatient services hiked by 2.2 percent, the group of hospital services by 3.0 percent, the group spent on private transportation by 1.1 percent, the group of organized tourist trips by 4.3 percent, and the group of ready meals by 8.2 percent.
Comments
Leave a Comment